Resources
Blog
Gain insights into the latest market trends and groundbreaking technological advancements in the semiconductor industry.

Wes Smith Bootstrapped Interview
Galaxy Semiconductor isn't a new company, but it is a startup. Founded in 1998, Galaxy was bootstrapped for many years before it was acquired by Siemens in 2016. Four years later, Siemens divested the company in a management buyout. Wes Smith (employee #7) was running the small business within Siemens before it became independent again — he naturally took on the role of CEO and led Galaxy into its next phase. In this episode of Bootstrapped, Wes talks about moving upstream into chip manufacturing, funding a new technology stack and getting it to market, the value of a consistent sales process, Rolodexes, and more.

When testing chips in production, measurement system error is your enemy. It can make a good part look bad, resulting in lower yields as you throw away parts that are actually good. Or, even worse, it can make a bad part look good, resulting in a field failure which is costly in many ways.
Since a gage study is a gating item to production testing, spending less time running and debugging after the results of a gage study can get you to market faster, giving you a leg up on competition, and increasing your bottom line!
The most common method of understanding and improving your measurement system error is by running a gage study. This analyzes the repeatability (how accurate can the same system measure the same part) and reproducibility (how accurate can different testers, loadboards, sites, etc measure the same part) of your measurement system. The main metric used for the result of the gage study is an R&R % which is a function of your repeatability and reproducibility. Generally speaking, if it’s over 30% it needs to be investigated further, and resolved if possible. However, many industries use gage studies, and many of the measurements taken don’t have any spec limits. In those cases the R&R % is the golden standard. However in the product and test engineering world, we have test limits for the parameters we are measuring and we can use this as an advantage in gage studies to reduce chasing our tails, debugging time, and getting to market faster!
What if I told you this test had an R&R% of 46% mainly due to the tester to tester reproducibility? Since it’s over the 30% threshold, you’d need to spend a lot of time debugging, and trying to fix the issue with experimenting with new matching components on the board, or wait time / methodology changes in how the test was run.
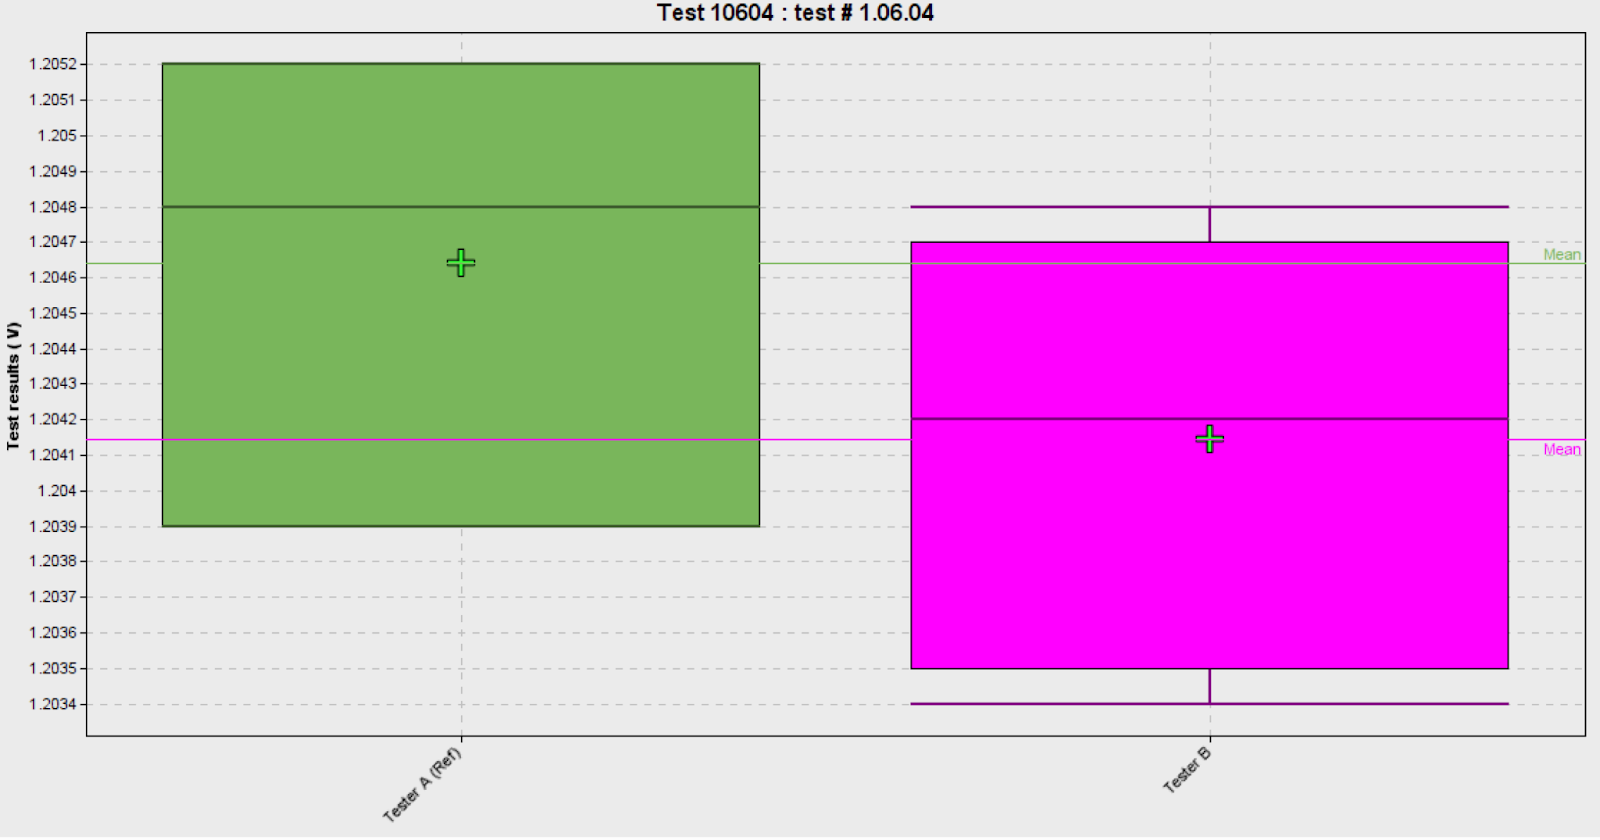
But we have the luxury of having test limits! What if I zoomed out, and showed you where our typical measurements are in relation to the actual test limits?
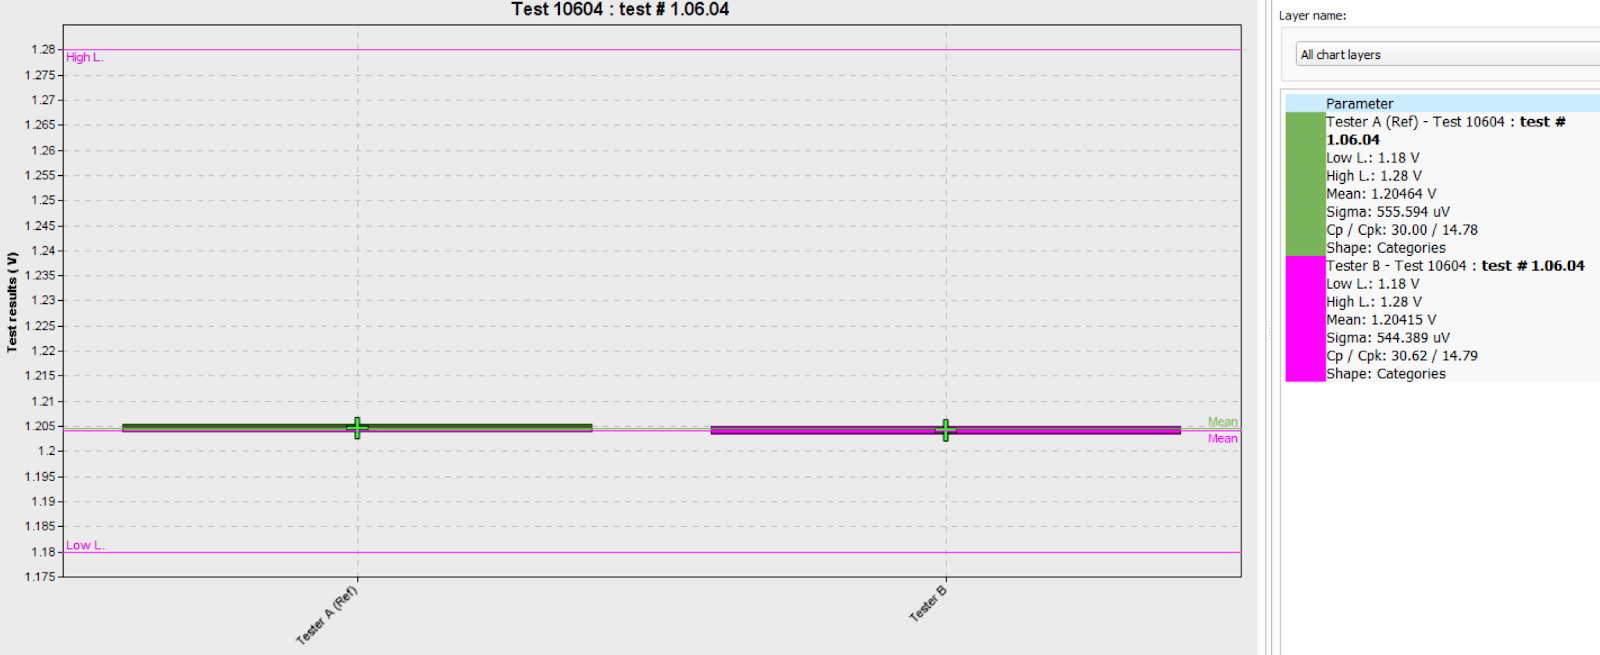
You can barely see a difference in the results now, and in relation to the test limits (with a cpk of roughly 15) do you think the tester to tester reproducibility would be an issue in production? Absolutely not! Since we have this luxury of having test limits, we can use a more meaningful metric called the Precision to Tolerance ratio (P/T%). This is very close to the Gage R&R formula but instead of dividing the R&R (repeatability and reproducibility) by the limitless total variation, it divides it by your limit space (upper limit - lower limit). So if the R&R% was an alarming 46% (over the 30% threshold needed to invest time into debugging the “issue”), what do you think the P/T% is? Go ahead, make a guess! Well, it’s a whopping 1.81%!
What does this mean to you as a product or test engineer? It means you can spend less time chasing your tail debugging your gage study results for “issues” that aren’t really there since you have the luxury of test limits and performance results. In fact in this part’s data, a normal Gage R&R% flagged 53 tests as being over the 30% threshold whereas the P/T ratio only flagged 1! That could save you weeks, or even months of wasted debugging that isn’t necessary!
Gage studies can be performed using many different tools. When doing so, use the P/T ratio with your data that has test limits and then go enjoy all that extra time not spent debugging on the beach! Galaxy’s Examinator also has the ability to run gage studies with either R&R% or the P/T% so you can see the difference for yourself, and you can start a free trial today! Click here to learn more! https://www.galaxysemi.com/products/examinatorpro

EDA Solutions Limited announce Reseller Agreement with Galaxy Semiconductor

Fareham, UK, and Menlo Park, California, USA, 8th September 2020 - EDA Solutions Limited announce a new agreement with Galaxy Semiconductor, provider of test data analysis and defect reduction software, that will see EDA Solutions become their reseller in Europe and Israel.

EDA Solutions will be acquiring sales responsibility for the full range of products by Galaxy Semiconductor which solve yield, productivity, and cost problems for engineers of semiconductor devices.
"Our enviable track record supporting IC design customers for mixed-signal, photonics, printed electronics and MEMS devices make us the perfect fit to work with Galaxy", stated Paul Double, Founder and Managing Director of EDA Solutions.
"Galaxy's technology is the de facto standard for test data analysis, IC yield management, and quality enhancement solutions for the semiconductor industry. This will be a great match for our customer base in Europe and Israel. We are excited to help our customers adopt Galaxy's technology and to support them as they bring their innovative products to market."
Galaxy's technology is very compelling to EDA Solutions customers because of its very broad industry adoption, acknowledged ease-of-use and cost sensitive pricing.
"We are looking forward to having the EDA Solutions team on board to support our customers. We are working diligently to deliver our next generation product portfolio to provide the semiconductor industry with intelligence that enables better decision making and process improvement." said Wes Smith, CEO at Galaxy Semiconductor.
The new contract marks EDA Solutions' latest move to expand their European footprint in the semiconductor markets by providing best-in-class IC design and analysis solutions.
Original Article:
Press Releases
Find the latest news and information about our company's developments, contributions, and announcements.


